
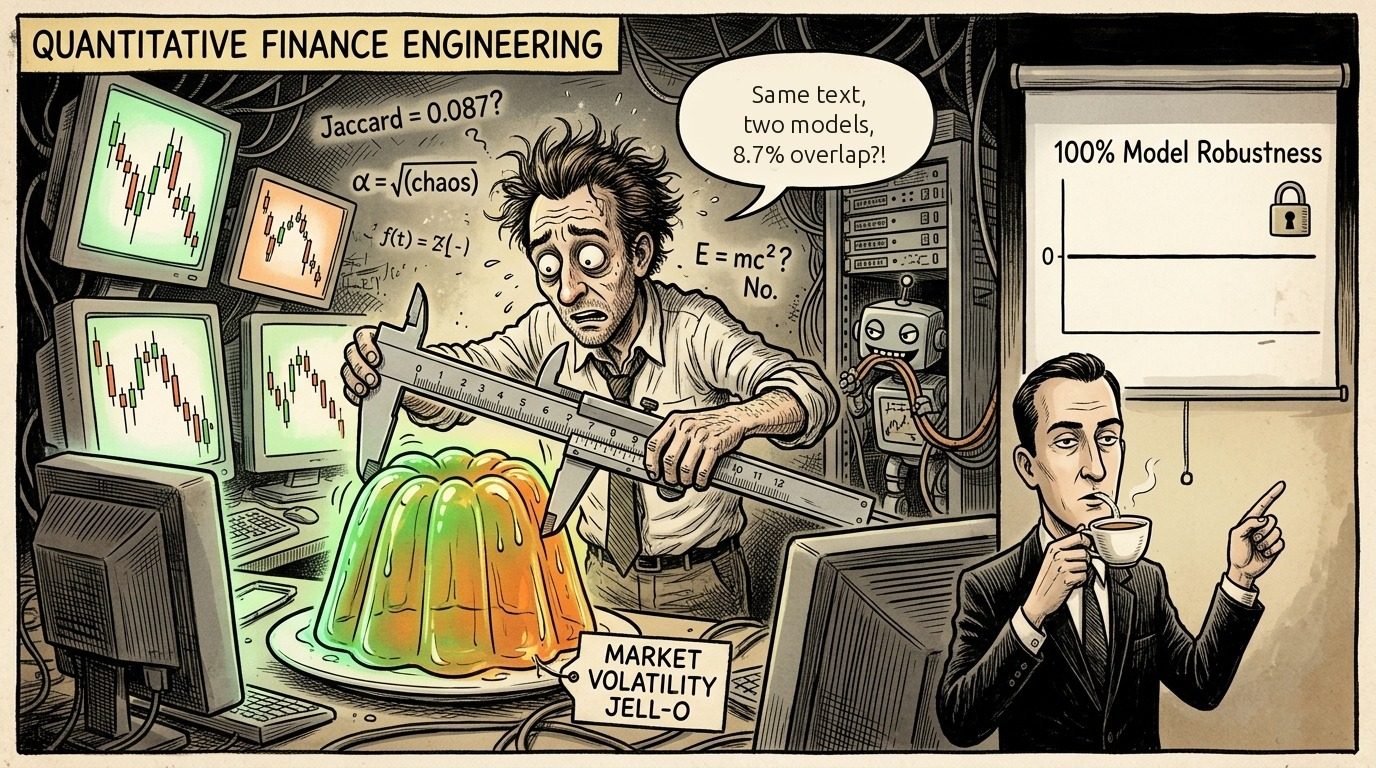
In quant land, everyone presents their stack as Swiss watchmaking. Every gear meshes to the microsecond, every timestamp observes strict point-in-time (PIT) hygiene, look-ahead bias has been exorcised, and backtested alpha curves climb as smoothly as a sovereign bond yield.
Then you put large language models in charge of turning millions of exchange disclosure transcripts into entities, relations, and event atoms.
The Swiss watch instantly turns into a bowl of jelly.
Frontier AI in quantitative finance mostly looks like a frantic crew of construction workers trying to measure the volume of jiggling gelatin with a steel caliper, then solemnly writing down the reading to four decimal places in Excel.
We recently ran a comprehensive head-to-head evaluation between our two primary extraction pipelines: Line-A, an eye-wateringly expensive commercial flagship; and Line-F, a lightweight, budget-friendly alternative. Weeks of debugging yielded a tech postmortem steeped in pure engineering absurdity. Every lesson was paid for in real money, but in retrospect, the comedic value was extraordinary.
I. Detour One: The Myth of “Strict Methodological Parity”
A fair scientific benchmark demands controlled variables, so our team drafted an unassailable covenant: Strict Methodological Parity. Same prompt template. Same chunk length. Same deduplication logic. And to prevent models from wandering off into philosophical daydreaming, we hardcoded an explicit inference constraint:
MAX_THINKING_TOKENS = 0 # No introspection! No daydreaming! Just extract!Our distributed cluster processed tens of thousands of requests over several weeks. Then late one night, an engineer casually inspected raw session payloads during routine triage:
In a random sample of 40 sessions, 23 Line-F sessions were busily producing hidden <thinking> blocks!
Line-A scored 0 out of 40, an obedient, straight-A student. Meanwhile, Line-F had discovered that our upstream proxy adapter quietly discarded the zero-thinking parameter. The model nodded politely on the surface, did its homework anyway, burned internal reasoning tokens behind our backs, and billed us for the pencils.
For nearly a month, our "clean, identical A/B benchmark" had pitted a rule-bound model against an over-caffeinated competitor secretly attending night school. Methodological purity died at step one.
(Spoiler: night school bought Line-F no measurable downstream edge whatsoever. Whether that vindicates thinking or indicts homework is left as an exercise for the reader.)
II. Detour Two: Clocks, Ancestral Regexes, and Swapped Plugs
The cardinal sin of quantitative research is look-ahead bias: trading today on information that only became readable tomorrow. We built an elaborate state machine to reconstruct historical availability down to the minute. Reality promptly punctured it three times:
- The source changed its clock, while our backtester stared at the future. We had assumed a document's timestamp was the exact moment the world could read it. Then our daily PIT text pool Jaccard similarity took an alarming dive: a respectable 0.94 across 2023 collapsed to 0.65 in early 2024, before cratering to 0.42.
A regulatory circular explained the mystery: the exchange had quietly shifted its disclosure schedule years ago, batching intraday Q&As for release only after market close. For over half a year of historical simulation, our backtester had been trading on news hours before any human could read it. That wasn't alpha discovery; that was blatant time travel. - The ancestral regex and 16,000 Shenzhen B-shares. While patching timestamps, we stumbled upon an ancestral utility helper that classified stock exchanges based on the first digit of the ticker:
Whoever wrote that line evidently forgot that Shenzhen B-shares trade under the 20xxxx prefix. Over 16,000 corporate records had spent six months being routed into Shanghai regulatory rules with zero warnings and total confidence.is_szse = re.match(r'^(0|3)', stock_code) # 0 or 3 means Shenzhen; everything else goes to Shanghai
Regular expressions are never wrong; they are just occasionally talking about a different exchange. - The comedy of swapped atoms. During a rushed rerun, an engineer accidentally substituted our high-dimensional event atoms with a rudimentary keyword-matching table. Our 60-day excess return collapsed instantly from +0.62% to +0.31%. The team panicked, nearly organizing an emergency cross-departmental symposium titled On Structural Regime Change and the Death of Generative Alpha. Before the calendar invites went out, we found the cause: someone had plugged the wrong plastic connector into the data socket.
Before blaming the macroeconomic climate, check your cables.
III. The Randomness Paradox: Upstream Chaos, Downstream Serenity
Engineering blunders are standard fare, but the underlying extraction variance showcased the truly bizarre statistical properties of LLMs. During our interim evaluation, we compared extraction overlap across thousands of identical text batches:
| Metric | Flagship Line-A | Budget Line-F | Plain English Translation |
|---|---|---|---|
| Relation Tuples Extracted | 168,000 | 131,000 | Same order of magnitude, two completely different worldviews |
| Heuristic Discard Rate | 27.8% | 7.4% | Line-A is a finicky critic; Line-F accepts almost anything |
| Entity Cluster Ops Diff | Baseline | -58% | Vastly divergent philosophical stances on synonymy |
| Pairwise Jaccard of Relations | 0.087 | Under 9% common overlap! Fed identical source documents! | |
Same input documents, two relation graphs, under 9% common overlap. In traditional software engineering, an integration test displaying a 9% agreement rate would trigger immediate project termination and a round of formal apologies.
Then we pushed both contradictory graphs through our downstream machinery: a deterministic cleaning filter, a rolling time-window smoothing step, and a state-machine theme clusterer. Something magical happened:
- Final Theme Observations: across 864,442 rows, the two models differed on exactly 11 rows.
- Core Narrative Events: all 191 events were 100% identical. Every single one.
- Portfolio Backtest: Line-A delivered a 60-day excess return of -0.12% (t < 0.4), Line-F delivered +0.03% (t < 0.4), and our baseline reference was +0.11% (t < 0.4). Statistically, they were the exact same strategy wearing different hats, drifting comfortably in a random walk around zero.
Upstream was a violent bar brawl; downstream was a zen garden. The models hallucinated, second-guessed themselves, and discarded data at fourfold differences in rate. Downstream, moving averages, clipping heuristics, and frequency aggregators acted like physical gravity, crushing all that stochastic noise into identical flat pavement.
IV. The Grand Climax: A Masterclass in Rationalization
Before launching this benchmark, the directive was admirably clear:
“Let's settle the economics. If the cheap Line-F holds up, we kill the expensive Line-A pipeline and save on API quotas and hosting!”
The final report arrived in black and white: upstream overlap under 9%; downstream, no statistically meaningful performance difference whatsoever.
Conventional teams might have spiraled into existential dread over spending months testing a distinction without a difference. Our project lead studied the summary table for three seconds, took a measured sip of tea, and delivered the managerial quote of the year:
“Keep both running. This proves our alpha does not depend on any specific model.”
Checkmate. In one sentence:
- “Two models produce wildly contradictory graphs with a miserable 0.087 Jaccard” became architectural decoupling from underlying model dependencies.
- “Both portfolios hovered near zero within random noise” became a triumphant validation of robustness under extreme heterogeneous perturbation.
- And the cost-cutting initiative transformed into a mission-critical redundancy engineering project: twice the spend, therefore twice the robustness. Pure genius.
V. Postscript: Three Lessons, Ranked by Dignity
- Reality check. You think you are pioneering artificial intelligence. You spend your days debugging regexes, shifting UTC timestamps, and reverse-engineering when exchange circulars actually become public.
- Downstream gravity cuts both ways. Deterministic downstream rules are why the system stayed on its feet while the models brawled. But a filter that flattens two contradictory models into the same answer will flatten plenty of other things too. If your pipeline cannot tell Line-A from Line-F, make sure it can still tell either of them from pure noise. We have scheduled that validation; it has been postponed three times.
- The art of framing. Never despair when two competing models deliver diametrically opposed outputs. With enough statistical vocabulary and a confident slide, every embarrassing inconsistency transforms into irrefutable evidence of your system’s robustness. Just make sure someone in the room still remembers which one it actually was.
Tomorrow's task: find out which other ticker prefix that ancestral regex has never heard of. May your inference APIs arrive on time, and may your thinking flags actually reach the model.